SRE monitoring tool for teams that need root cause, not just alerts
AutomateSRE combines website uptime checks, server service monitoring, log analysis, AI root cause reports, and optional auto-restart in one dashboard.
What an SRE monitoring tool should catch
Traditional uptime tools tell you a site is down. AutomateSRE is built for the next question: which service failed, which log explains it, and what should be done next. The agent tracks web servers, PHP-FPM, databases, cache layers, process health, CPU, memory, disk, and selected application logs for the monitored site.
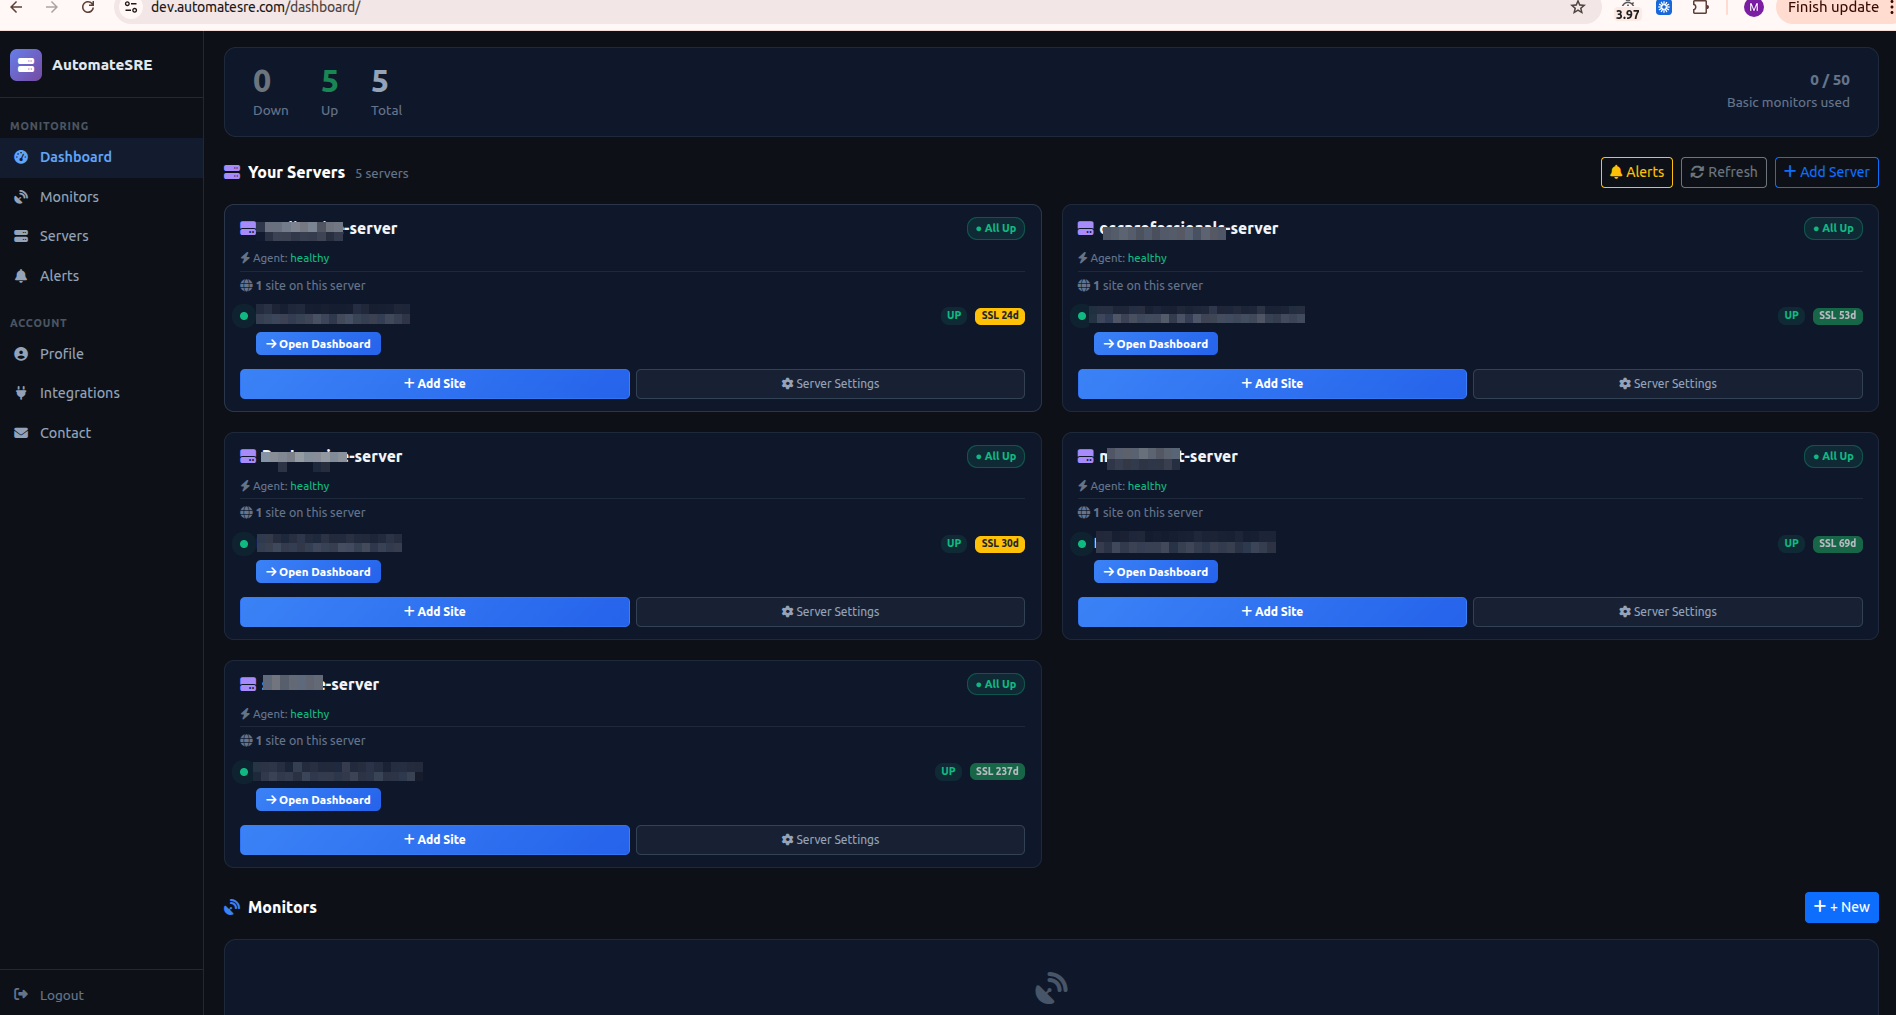
What AutomateSRE Tracks
HTTP and HTTPS uptime monitoring with email and Telegram alerts.
Agent-based service checks for Nginx, Apache, PHP-FPM, MySQL, MariaDB, Redis, Varnish, and Elasticsearch.
AI root cause analysis from server logs and live metrics.
Optional auto-restart for failed services when your policy allows it.
Built For Real Production Incidents
Per-site service detection
AutomateSRE focuses on the site being monitored. If a server hosts multiple applications, the dashboard tracks the services and logs that matter to that site instead of mixing unrelated processes into every alert.
Incident context for SRE teams
Each incident can include current service state, system load, relevant log lines, suspected cause, timeline, and recovery status. This reduces the time spent jumping between SSH sessions, dashboards, and raw log files.
Built for LAMP and LEMP production stacks
The monitoring flow is optimized for PHP applications, Magento, WordPress, Nginx, Apache, Varnish, Redis, MySQL, MariaDB, and Elasticsearch. The goal is practical production visibility for common commerce and content platforms.
How Setup Works
AutomateSRE is designed to start from the site URL and then connect server-side context only when full monitoring is enabled.
- Add the website URL you want to monitor.
- Install the lightweight outbound agent with one command.
- AutomateSRE discovers relevant stack services and log paths.
- Alerts include root cause context and recovery status.
Questions Teams Ask
What is an SRE monitoring tool?
An SRE monitoring tool helps reliability teams detect downtime, service failures, performance issues, and root causes across websites, servers, and application logs.
Does AutomateSRE require inbound SSH access?
No. The AutomateSRE agent runs on the customer server and ships telemetry out over HTTPS. The platform does not need an inbound SSH connection for normal monitoring.
Can AutomateSRE restart failed services?
Yes, auto-restart can be enabled per site/server policy for supported services such as PHP-FPM, Nginx, Apache, MySQL, Redis, and Varnish.
Start monitoring the site and the stack behind it.
Use AutomateSRE for uptime, services, logs, AI root cause analysis, and recovery visibility from one production dashboard.